datascience
![]()
Your Datascience, Machine Learning and AI Hub
Data visualization mini-course with Python
This mini course will teach you how to create Python visualizations for data Science jobs, using simple resources. Each lesson will address a topic. Check it out:
1 - Turbo introduction to charts
In this lesson we will see the basic part of generating charts, with formatting and positioning of the most common charts.

See HERE the Jupyter Notebook.
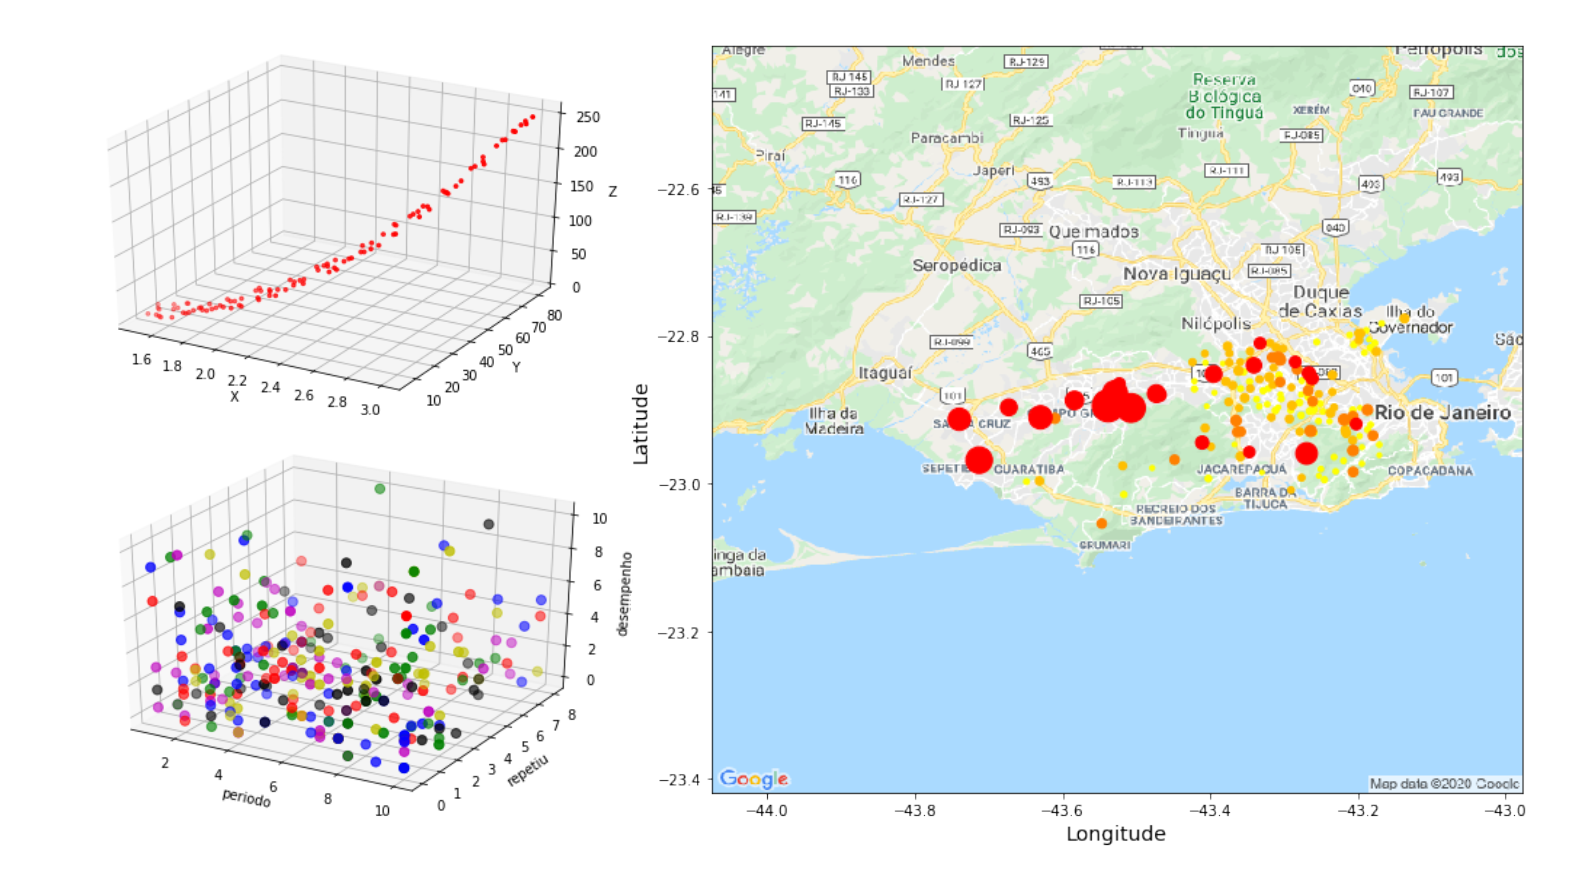
2 - Data visualizations with more than 2 dimensions:
In this lesson, we’ll look at how to provide visualizations with more than two dimensions of data.
See HERE the Jupyter Notebook.